Longitudinal phenotype analysis
Analysing longitudinal phenotype data with NOR
When it comes to genome-wide association studies, longitudinal phenotypic data is becoming more and more desireable as the results are by far more powerful than baseline analysis^1. In this tutorial we will showcase useful queries to retrieve meaningful data from longitudinal data sets.
For the purpose of showcasing the GOR query language capabilities we will start by simulating data, using a GTEx phenotype file as a starting point, see the query in the appendix below.
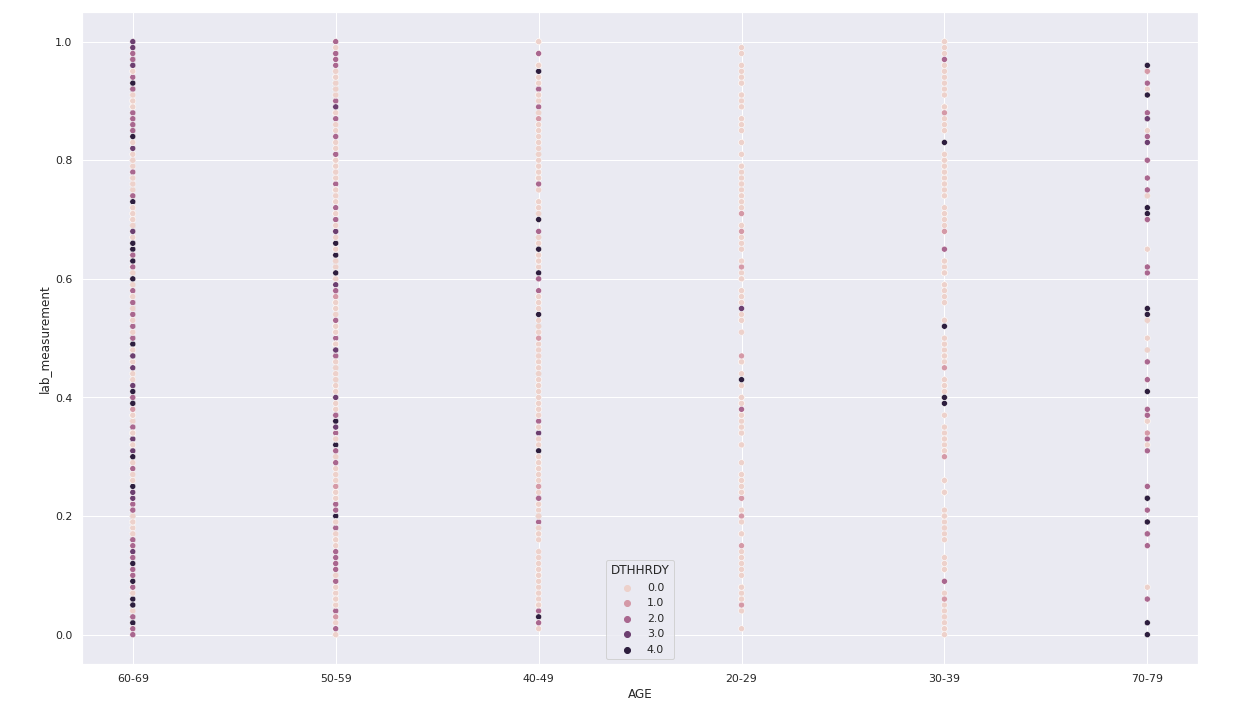
A quick look at our longitudinal data set nor lab_measurements.tsv shows we have 1780 rows and eight columns; SUBJID, SEX, AGE, DTHHRDY, DOD, DOB, lab_measurement and lab_date. Lets begin by answering a couple of simple questions about the data set and retrieve the number of unique patients in one column called allCount
nor lab_measurements.tsv
| unpivot 1-
| where col_name = 'SUBJID'
| distinct
| group -gc col_name -count
Note that you can filter on any column and get the count of unique values in that column by changing the where condition. Next we retrieve the number of measurements for each individual
nor lab_measurements.tsv
| group -gc subjid -count -ic lab_measurement
| sort -c allCount:r
Adding the sort command orders the data set returning the individual with the most lab measurements at the top. Then we can return the average age in years per males and females. Here we can make use of the yeardiff() function and the group command along with the -avg flag, more on date functions here.
nor lab_measurements.tsv
| calc age_in_years yeardiff('yyyy-MM-dd',DOB,DOD)
| group -gc sex -avg -ic age_in_years
Next we return the most recent lab measurement for each individual
nor lab_measurements.tsv
| group -gc subjid -max -sc lab_date
An alternative version would be to use the granno command which would result in a new column max_lab_date without collapsing any rows | granno -gc subjid -max -sc lab_date. Similarly we could retrieve the highest lab measurement for each individual using the atmax command
nor lab_measurements.tsv
| select subjid,lab_measurement,lab_date
| atmax lab_measurement -gc subjid
Another interesting question might be to return all individuals with two or more lab measurements on any given date
nor lab_measurements.tsv
| group -gc subjid,lab_date -count -ordered -lis -ic lab_measurement
| where allCount >= 2
Lets say we know that more than one measurement per day is an indicator of hospitalisation and three measurements per day indicates an emergency room visit. To keep track of this information we calculate a column called visit_type and store only the average measurement per each day in the lab_measurement column effective
create ##hospital_visits## = nor lab_measurements.tsv
| group -gc subjid,lab_date -count -ordered -lis -avg -ic lab_measurement
| where allCount >= 2
| replace avg_lab_measurement form(avg_lab_measurement,4,2)
| calc visit_type if(allCount=3, 'Emergency Room', 'Inpatient')
| rename avg_lab_measurement lab_measurement
| select subjid,lab_date,lab_measurement,visit_type;

nor lab_measurements.tsv
| group -gc subjid,lab_date -count -ordered -lis -ic lab_measurement
| rename lis_(.*) #{1}
| where allCount < 2
| calc visit_type 'Outpatient'
| select subjid,lab_date,lab_measurement,visit_type
| merge [##hospital_visits##]
Here we first create a table with the information of hospital visits and combine that information to our original table using the merge command. Now we could easily gather additinal information such as the number of emergency room visits in the data set by adding | group -gc visit_type -count.
Finally we are interested in retrieving the number of individuals that have two or more lab measurements above 0.5 within a year of each other
nor lab_measurements.tsv
| select subjid,lab_measurement,lab_date
| where lab_measurement > 0.5
| rownum
| multimap -c subjid <(nor lab_measurements.tsv | select subjid,lab_measurement,lab_date | where lab_measurement > 0.5)
| where lab_date != lab_datex and daydiff('yyyy-mm-dd',lab_date,lab_datex) < 365
| group -gc subjid,lab_date,rownum
| group -gc subjid -count
| where allCount >= 2
Here we use multimap to map back to the data set itself comparing each lab date to all other lab information of a given patient. This method can quickly become rather costly as it is dependant on the number of individuals times each of their measurements. An optimisation might be to use the -ordered flag with the multimap command, only loading into memory measurements for one individual at a time
create ##ordered_measurements## = nor lab_measurements.tsv
| select subjid,lab_measurement,lab_date
| sort -c subjid;

nor lab_measurements.tsv
| select subjid,lab_measurement,lab_date
| where lab_measurement > 0.5
| rownum
| multimap -c subjid -ordered [##ordered_measurements##]
| where lab_date != lab_datex and daydiff('yyyy-mm-dd',lab_date,lab_datex) < 365
| group -gc subjid,lab_date,rownum
| group -gc subjid -count
| where allCount >= 2
Notice that we need to run through the entire data set once and order the subjects, this is done in the create statement at the beginning.
Finally we could apply a similiar method as above and calculate a column to indicate the severity of each case, defining the most severe case as those with two or more lab measurments above 0.5 that occur within a year period, moderately severe cases as those with at least one measurement above 0.5 in the past two years and others as low severity cases
create ##ordered_measurements## = nor lab_measurements.tsv | select subjid,lab_measurement,lab_date | sort -c subjid;

create ##severe## = nor lab_measurements.tsv
| select subjid,lab_measurement,lab_date
| where lab_measurement > 0.5
| rownum
| multimap -c subjid -ordered [##ordered_measurements##]
| where lab_date != lab_datex and daydiff('yyyy-mm-dd',lab_date,lab_datex) < 365
| group -gc subjid,lab_date,rownum
| group -gc subjid -count
| where allCount >= 2
| calc severity 3
| select subjid,severity;

create ##moderate## = nor lab_measurements.tsv
| select subjid,lab_measurement,lab_date
| where lab_measurement > 0.5
| rownum
| multimap -c subjid -ordered [##ordered_measurements##]
| where lab_date != lab_datex and daydiff('yyyy-mm-dd',lab_date,lab_datex) < 730
| group -gc subjid,lab_date,rownum
| group -gc subjid -count
| where allCount >= 1
| calc severity 2
| select subjid,severity;

nor lab_measurements.tsv
| calc severity 1
| select subjid,severity
| merge [##severe##]
| merge [##moderate##]
| group -gc subjid -max -ic severity
| calc severity if(max_severity=3,'High',if(max_severity=2,'Moderate','Low'))
| select subjid,severity
| group -gc severity -count
This concludes the basics in analysing and querying longitudinal phenotype data using the GOR query language.Make sure to check out other blog posts - Happy GORing!
Appendix
/* Simulated longitudinal data */
create ##lab_1## = nor -h patient_pheno.tsv
| select SUBJID
| skip 100
| top 200
/* Random() function to generate random floating point values */
| calc lab_measurement form(random(),4,2)+','+form(random(),4,2);

create ##lab_2## = nor -h patient_pheno.tsv
| select SUBJID
| skip 50
| top 200
| calc lab_measurement form(random(),4,2)+','+form(random(),4,2);

create ##all_lab## = nor -h patient_pheno.tsv
| select SUBJID
| calc lab_measurement form(random(),4,2)
| merge [##lab_1##]
| merge [##lab_2##];

nor -h patient_pheno.tsv
| calc DOD date('yyyy-MM-dd')
| replace DOD adddays('yyyy-MM-dd',DOD,round(random()*10)+15)
| replace DOD addmonths('yyyy-MM-dd',DOD,round(random()*2)+3)
| calc today date('yyyy-MM-dd')
| calc DOB if(age='20-29',addyears('yyyy-MM-dd',today,-round((20+29)/2)),
         if(age='30-39',addyears('yyyy-MM-dd',today,-round((30+39)/2)),
         if(age='40-49',addyears('yyyy-MM-dd',today,-round((40+49)/2)),
         if(age='50-59',addyears('yyyy-MM-dd',today,-round((50+59)/2)),
         if(age='60-69',addyears('yyyy-MM-dd',today,-round((60+69)/2)),
         if(age='70-79',addyears('yyyy-MM-dd',today,-round((70+79)/2)),today))))))
| replace DOB adddays('yyyy-MM-dd',DOB,round(random()*10)+15)
| replace DOB addmonths('yyyy-MM-dd',DOB,round(random()*2)+3)
| multimap -c SUBJID [##all_lab##]
| split lab_measurement
| calc lab_date addyears('yyyy-MM-dd',DOD,round(random()*5-20)+10)
| replace lab_date adddays('yyyy-MM-dd',lab_date,round(550+random()))
| hide today
| write lab_measurements.tsv